Last week we saw a remarkable score in the Big Bash League, where the Melbourne Renegades scored 222 (a record BBL score). The Hobart Hurricanes then met the challenge, scoring 223 in response. We’ve seen the record for the most runs scored in a match broken twice in 2016: first with 489 runs in a T20 International between the West Indies and India in Florida, and then 497 runs in a New Zealand domestic match between Central Districts and Otago.
So my question: is this a broader trend, with more runs being scored across Twenty20 cricket? In this post I’ll attempt to find out, and also look at how different ways of scoring are becoming more or less prominent.
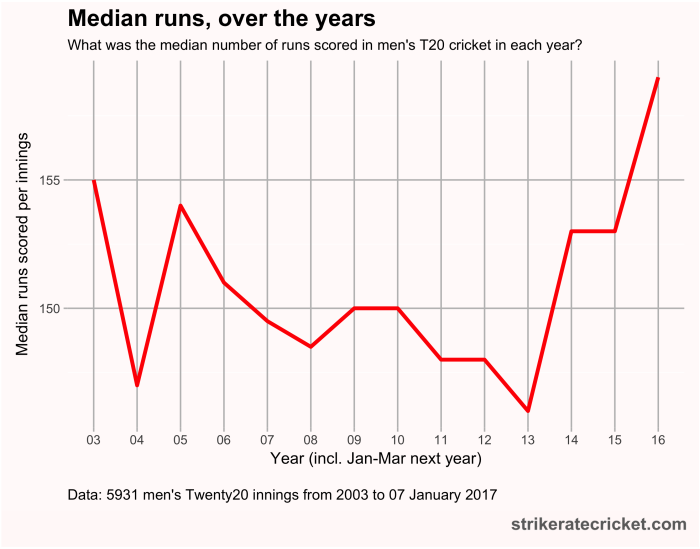
Firstly, let’s just look at the median number of runs scored in each innings. I wanted to simplify the results, but keep together whole seasons, so each year covers the northern summer in that year and the southern summer at the end of that year, so each year covers April-March.

The number of matches in 2003 and 2004 was particularly low, but once Twenty20 cricket became more stable we saw the median score stabilise around 150. It dropped from 2010 to 2013, but since 2014 the median score has shot up, to close to 160 in the last ten months.
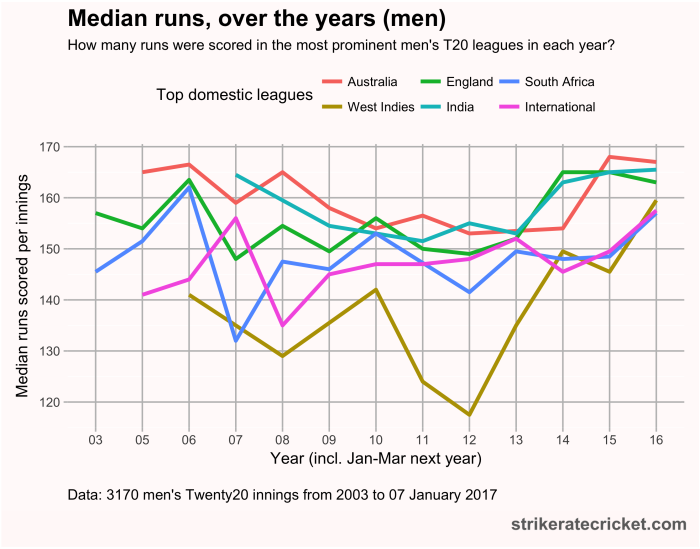
I wanted to isolate where this growth is happening: is it because matches are being played in different places, or is there a general increase in scoring rates?
This next chart shows the run-scoring rates for the top-level men’s domestic T20 league in five big cricketing countries, as well as the scoring rates for T20 Internationals.

Scoring rates are higher in Australia, India and England compared to the West Indies, South Africa and in international matches. While the data is noisy, it does appear that there has been a general spike across the last three seasons.
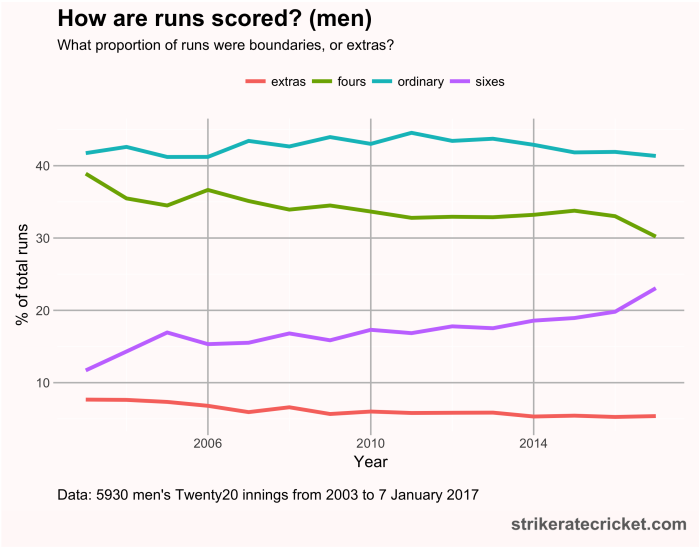
Secondly, I wanted to get a sense of how run-scoring has changed in terms of what sort of runs are scored. Runs can be split into four categories: fours, sixes, extras and ordinary runs scored by running between the wickets.

Over the last decade, we’ve seen an increase in the proportion of runs which are scored as sixes, while there has been a decline in the proportion of extras and the proportion of fours. Ordinary runs remain the primary way of scoring, and this has remained roughly steady just over 40% of all runs scored.
(It’s worth noting that the drop in fours and spike in sixes is off a very small sample – 8 BBL matches, 6 matches in the NZ domestic competition, and 2 internationals between New Zealand and Bangladesh).
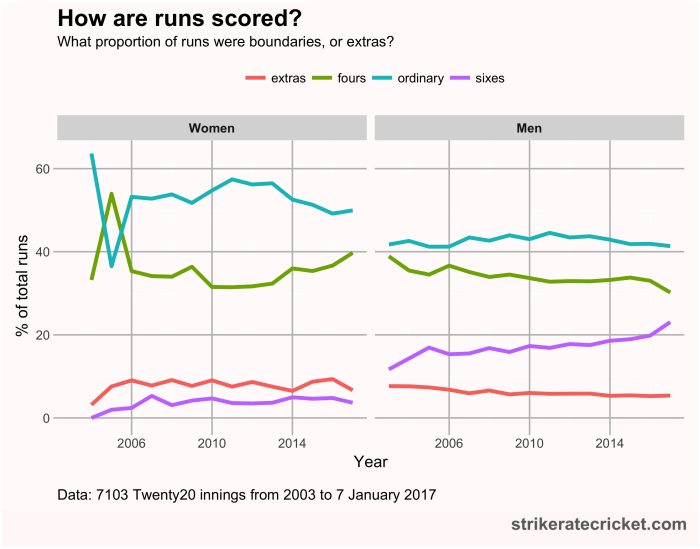
Finally, this chart shows the same men’s data as the above chart alongside the same data for women:

Ordinary runs make up a much larger share of runs in women’s cricket. Fours and extras make up similar shares as in the men’s game (with four-scoring increasing over the last three years), while six-hitting is a much less important part of the women’s game.

