Earlier this week, Matthew McInerney on Twitter posted about Mark Waugh in the commentary box for a Big Bash League game (I believe the second semi-final) suggesting that WBBL matches played beforehand were producing “slow pitches” for BBL matches.
@LadiesWhoLeague keen to hear thoughts from comms drawing parallel/blaming WBBL for slow pitches. If any.
— Matthew McInerney (@MMcInerney89) January 25, 2017
Unfortunately I didn’t see the comment, but this is something which can be analysed.
Double headers of the WBBL and BBL have been regularly scheduled throughout the last two seasons. Twenty-four out of seventy BBL games across 2015/16 and 2016/17 were scheduled immediately after WBBL matches at the same ground.
I assume that the same pitch was used for both matches in all of these double headers. So for each Big Bash League match held as part of a double header, the pitch has already been used for up to forty overs of women’s cricket that same day. At the one double header I attended, the steam roller was run over the pitch between matches, but it isn’t inconceivable that these pitches could be different.
A ‘slow pitch’ suggests to me that scores would be lower, and we can test this premise by comparing scores in matches preceded by a WBBL match, and those not preceded by such a match.
Firstly, let’s examine the total figures. My dataset doesn’t include the semi-finals and finals played in the last week, so just under 1/3 of the sample were double headers.
| Double header? | Matches | Median runs | Median balls | Median run rate |
|---|---|---|---|---|
| Yes | 21 | 317 | 235 | 8.18 |
| No | 45 | 320 | 234 | 8.35 |
The number of runs scored and the number of balls faced are roughly the same at the median point. The difference in the median run rate translated to 6.8 runs per match, which is slightly more than the run gap, but not much more.
Obviously this isn’t enough to answer this question. We don’t know the distribution of matches, and whether one is consistently less than another. More importantly, we don’t have a breakdown by venue. If pitches are having an impact, it seems far more plausible that there is greater difference between venues, rather than difference depending on the presence of a women’s team earlier in the day.
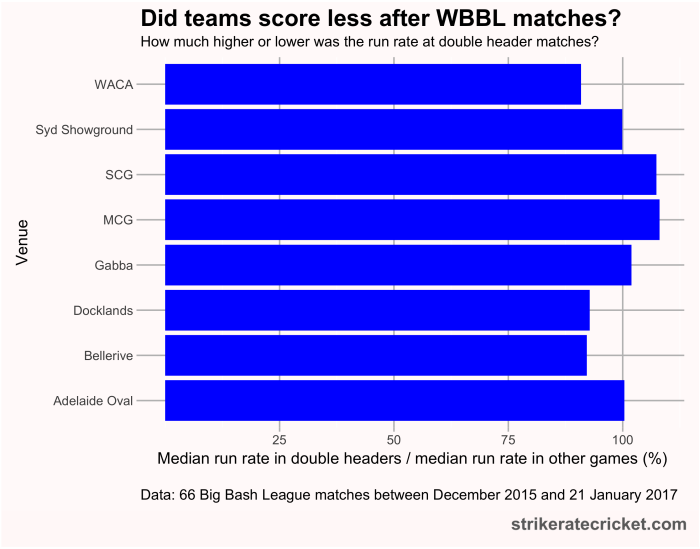
This first chart shows the difference between the median run rate in double headers and single matches at each of the eight grounds that hosted BBL matches in 2015/16/17.

A larger bar indicates that run rates were higher in double headers than in other matches. What we find is that there is no difference in run rate at the Adelaide Oval and the Sydney Showground (aka Spotless Stadium) while substantially more runs were scored at double headers at the SCG and MCG. Double headers produced lower scoring rates only at Docklands, Bellerive and the WACA.
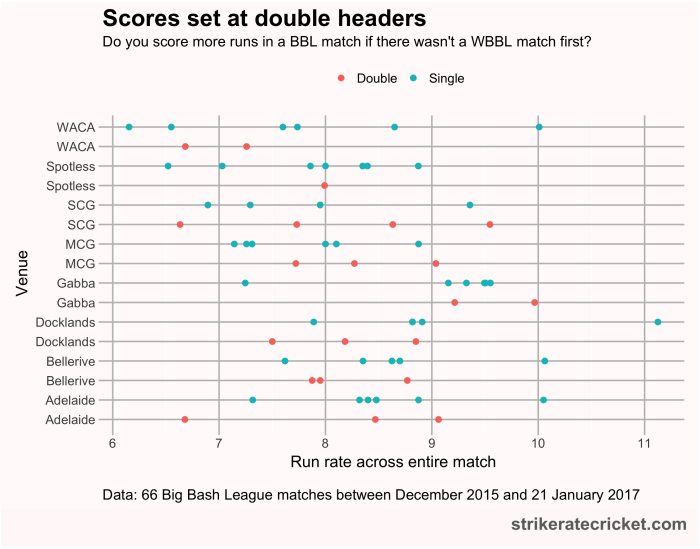
This next chart goes into a bit more detail. It shows the run rate for every match played in BBL05 and BBL06, broken down by venue. Red dots represent double headers, blue dots represent standalone matches.

I see no clear evidence of a trend. While the highest score was at a standalone game (445 runs scored at Renegades vs Hurricanes at Docklands), there are plenty of grounds where double headers produced more runs than single matches.
The lowest performance was a standalone match at Bellerive, the Gabba, the MCG, the Sydney Showground and the WACA. Only at the SCG, Docklands and Adelaide did this honour go to a double header match.
This isn’t definitive evidence of anything, but the available data suggests to me no proof that playing a women’s match on a pitch has any impact on the scoring in the following men’s match.

